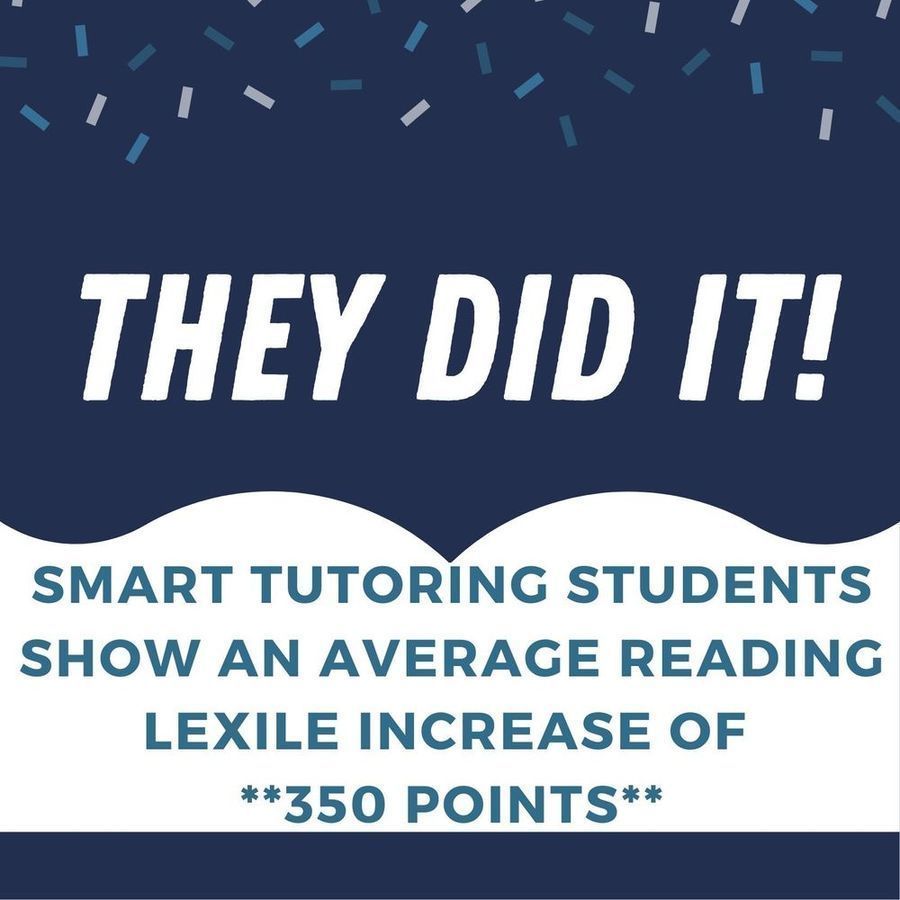
Summer 2022 Math & Literacy Results
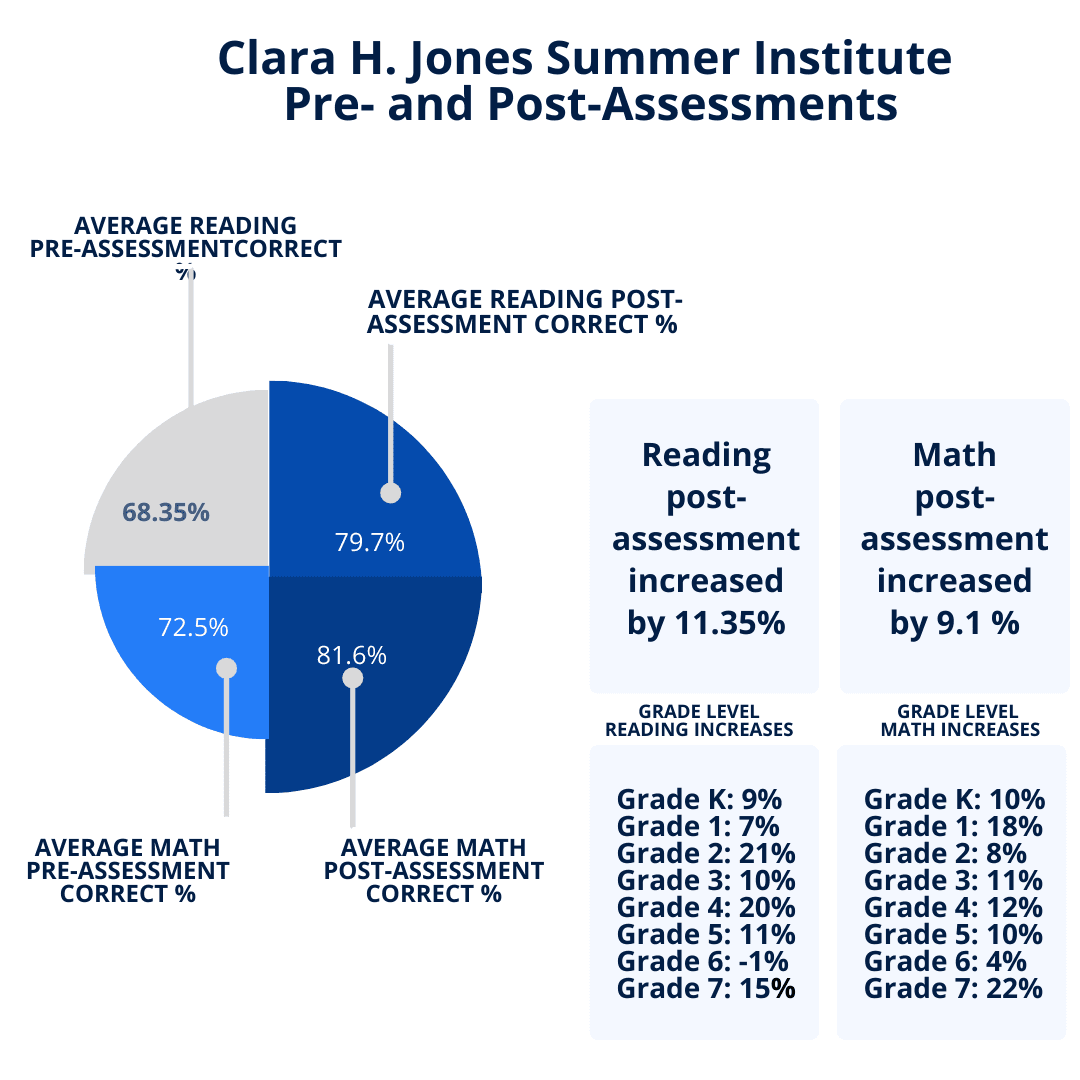
Summer 2021 Math & Literacy Results
| Grade | # Students | Literacy Increase | Math Increase | |
|---|---|---|---|---|
| K-1st | 14 | 24.3% | 30.4% | |
| 2nd | 7 | 13.7% | 15.2% | |
| 3rd | 5 | 24.0% | 26.6% | |
| 4th | 8 | 32.2% | 18.8% | |
| 5th | 11 | 24.7% | 11.0% | |
| 6th | 5 | 16.8% | 32.8% | |
| 7th | 5 | 32.6% | 22.6% | |
| 8th | 3 | 13.3% | 16.7% | |
| 9th | 2 | 37.0% | 30.5% | |
| Average Increase | 60 | 24.3% | 22.7% | |
| 83 Students Enrolled | 60 Completed Pre/Post Test |
SMART Tutoring Program
